Project Description
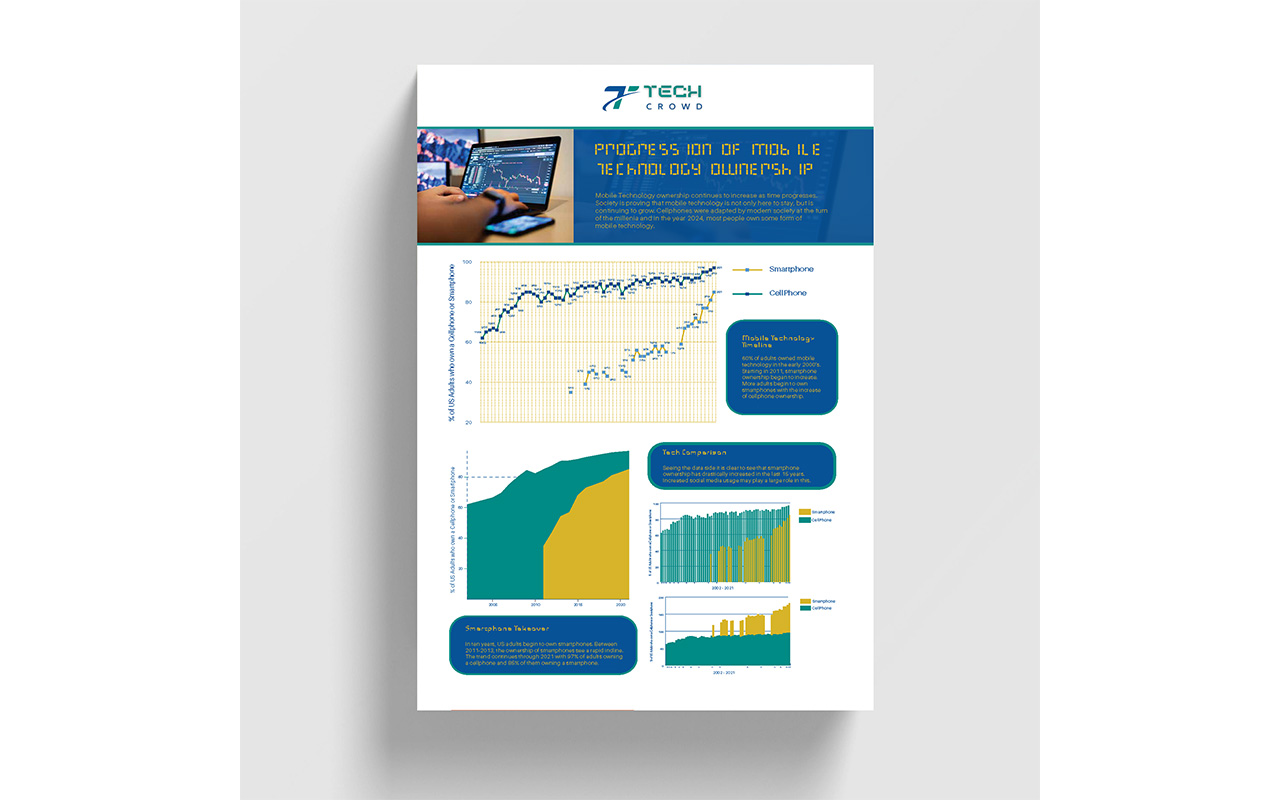
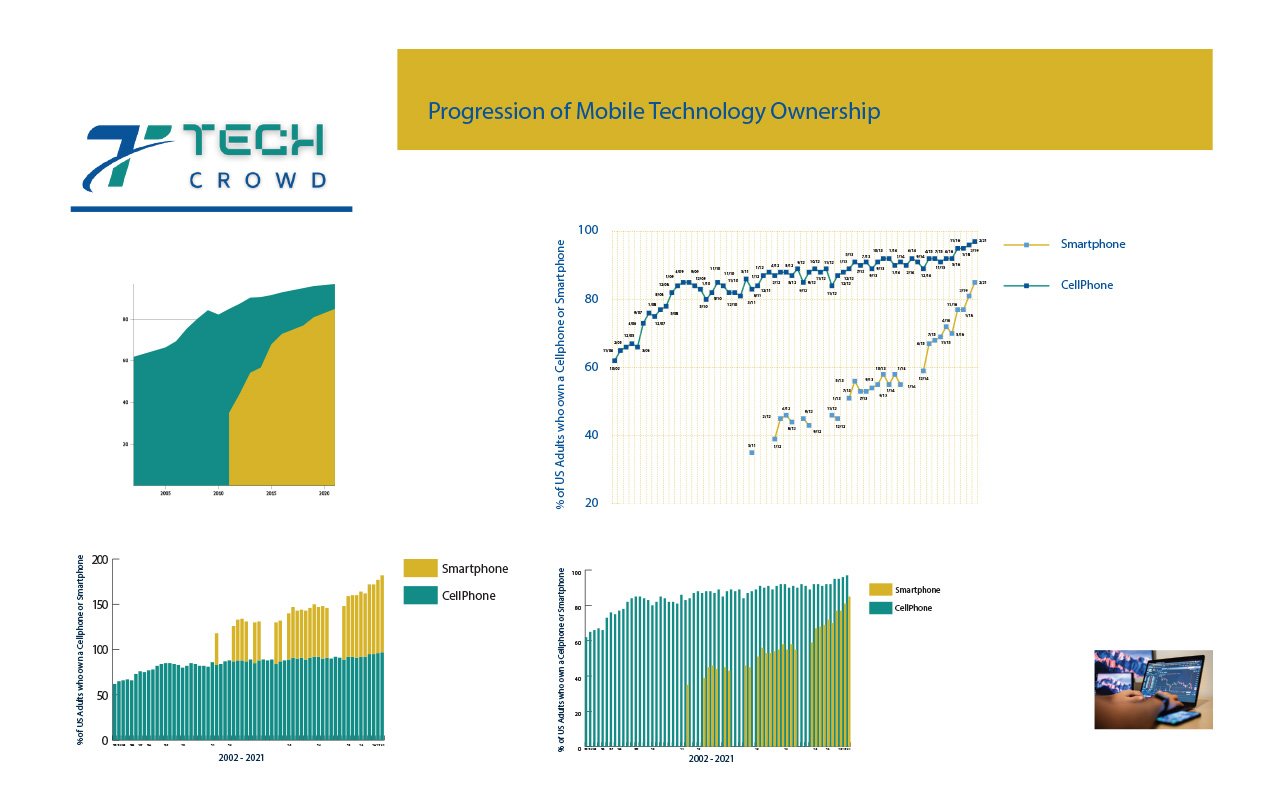
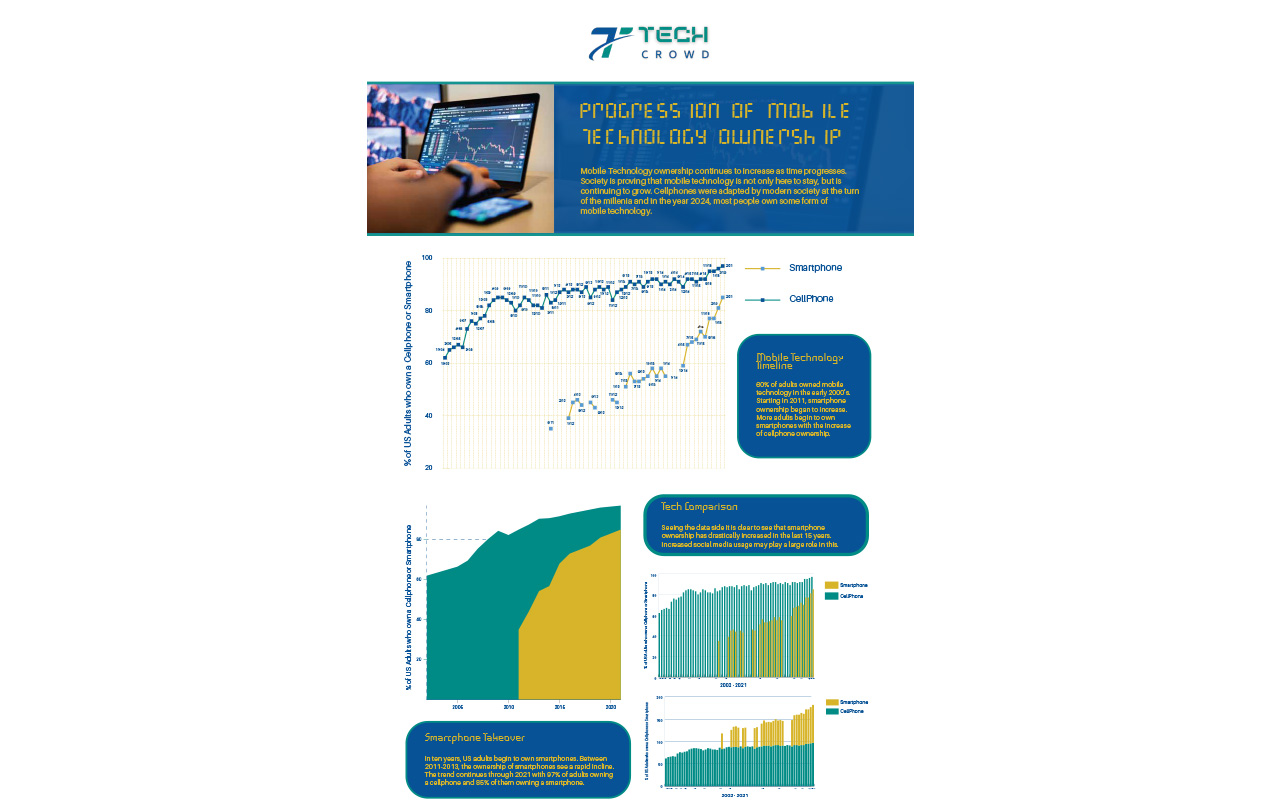
This graphic is the progression of mobile technology ownership. The aspects of the data that I will focus on include the dates and of course the percentages of the adults who own a smartphone. I want to show the relationship between the ownership of smartphones and the timeframe where this trend began. The intended audience will be young adults who are more likely to own a smartphone of their own.
The relationships between the variables begin with the dates and the ownership of cellphones. Cellphones became extremely popular during the 2000’s and the number of adults who owned one increased steadily as time progressed. The other relationship that is important to consider is the beginning of the adaptation of smartphones. 2011 was a major year for the ownership of mobile technology as people began owning smartphones at this time.
The intended story will be how time has increased mobile technology ownership. The data set tells me that there was already an increase of mobile technology ownership beginning in the early 2000’s. Starting 2011, adults began owning smartphones as cellphone ownership was also steadily increasing. Not many adults owned a smartphone until around 2013, where more than 50% of adults owned a smartphone. Big ideas represented by the data include: technology has increased in popularity as more adults become smartphone owners, social media may have a direct relationship to the popularity of smartphones, or has the adaptation of mobile apps in everyday society increase the need for adults to own a smartphone?
The visual element helps create context as most adults own some form of mobile technology today. It helps give the story visual appeal while giving the viewer a perspective of how the ownership of mobile tech has taken over. It enhances the story by communicating the idea of the story directly to the viewer.
